


Introduction
Data is everywhere, and developers are tasked with presenting it in a way that is easy to understand. As a developer, you understand the importance of data visualization in creating compelling and informative applications.
That’s where chart visualizations come in, and Chart.js is one of the most popular libraries for creating them.
Chart.js is a simple and flexible JavaScript charting library that allows developers to create beautiful and responsive charts easily. In this post, we’ll explore how you can use Chart.js to create stunning visuals for your data.
Getting Started with Chart.js
In this blog, I am using ReactJs.
So you will first have to set up a ReactJs project.
npx create-next-app
Then you will have to install the dependencies. In your terminal type this to install chart.js and react-chartjs-2 libraries.
React-chartjs-2 is a React wrapper for Chart.js 2.0 and 3.0, letting us use Chart.js elements as React components.
npm install chart.js react-chartjs-2
Once the installation is complete, you are good to go !!
Pie Chart
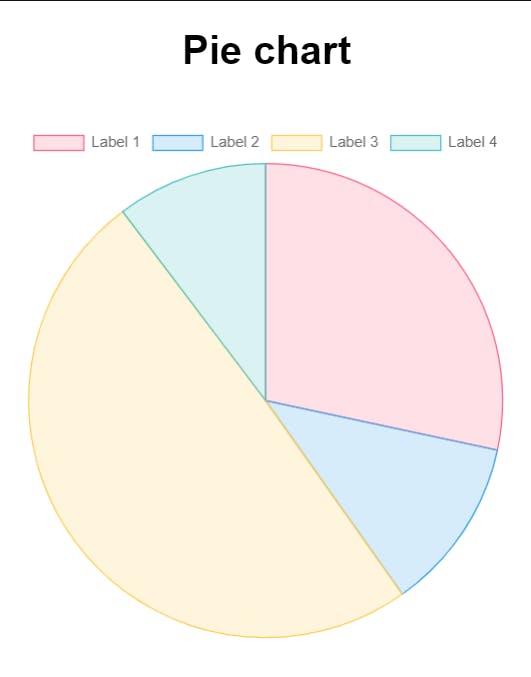
Now let's create our first chart! We'll start with a PieChart component, which we'll pass a data object as a prop. This data object contains two parts:
Labels: These are the names of the different sections in the chart. They'll help us understand what each part represents.
Dataset: This is where we'll provide the actual data that we want to visualize. It includes the label for the chart, which describes the data being shown, and the data itself, which is structured as an array. We can also customize the appearance of the chart by setting options like the border and background color.
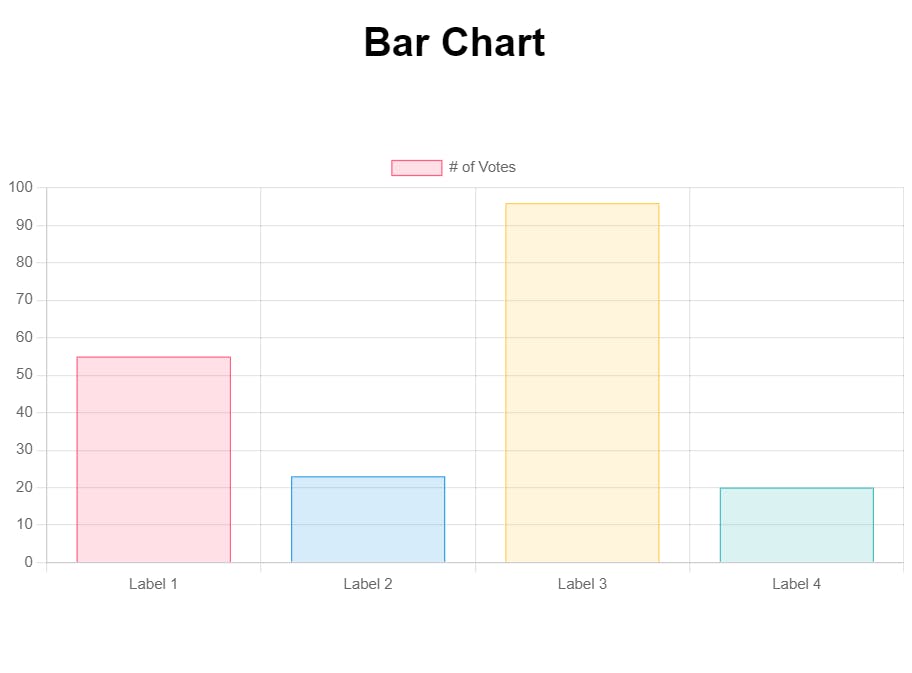
In addition to the Pie Chart component we created earlier, we can also use the same dataset to create other types of charts with Chart.js and React-chartjs-2. The beauty of these libraries is that once we have our data in the right format, it's easy to switch between different chart types.
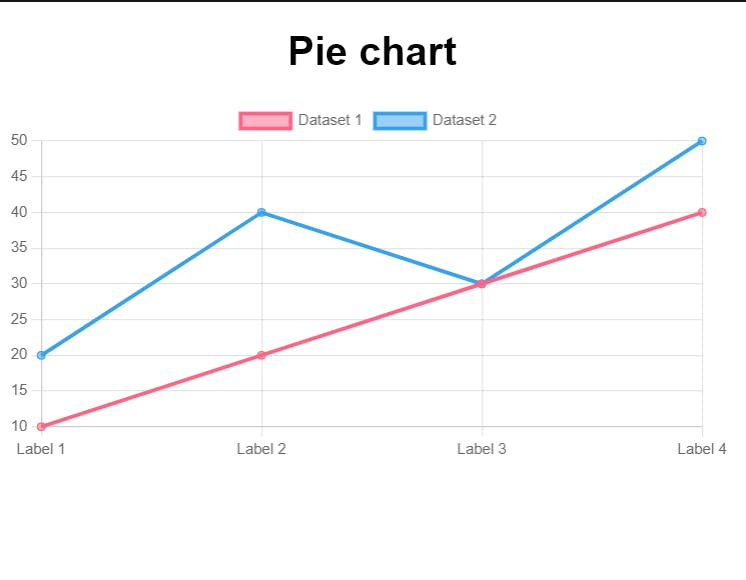
For example, in the code examples below, we've used the same dataset to create a Bar Chart, Line Chart, and Doughnut Chart, each imported from React-chartjs-2. As you can see, with just a few changes to the code, we can visualize the same data in a variety of ways.
This flexibility is one of the reasons why Chart.js is so popular among developers who need to present data in a clear and compelling way.
Bar Chart
Line Chart
Doughnut Chart
Conclusion
Chart.js is a powerful and flexible library for creating charts and graphs that are both visually appealing and informative. With its extensive range of customization options and interactive features, Chart.js is an ideal choice for developers looking to enhance the data visualization capabilities of their web applications.
Overall, Chart.js is an excellent tool for developers looking to create dynamic and informative charts and graphs. Whether you are a beginner or an experienced developer, Chart.js provides you with the flexibility and customization options needed to create visually appealing and interactive charts that will engage your users.
If you found this blog helpful, consider giving it a like and sharing it with your friends and colleagues. I'd love to hear your thoughts and experiences with the library, so feel free to leave a comment below and start a discussion. Till then keep learning and building, and I'll see you in the next blog.